Alex Labuda
Blog
A data science blog that works
Welcome to my Blog! Check back soon for new content.
Author
Alex Labuda
Visualizing Crime Patterns in Chicago: An Insightful 2015 Retrospective
From Numbers to Maps: Decoding Chicago’s Crime Data
gt
tables
news
Dive into an analytical exploration of Chicago’s 2015 crime data using interactive maps and dynamic tables, bringing numbers to life.
Jan 30, 2024
Mapping Haunted Places in New York
Exploring Eerie Locations with Interactive Leaflet Maps
Data Visualization
Leaflet
New York
Join us on a spine-tingling journey as we map out the most haunted places in New York, combining fascinating tales with interactive data visualization.
Jan 29, 2024
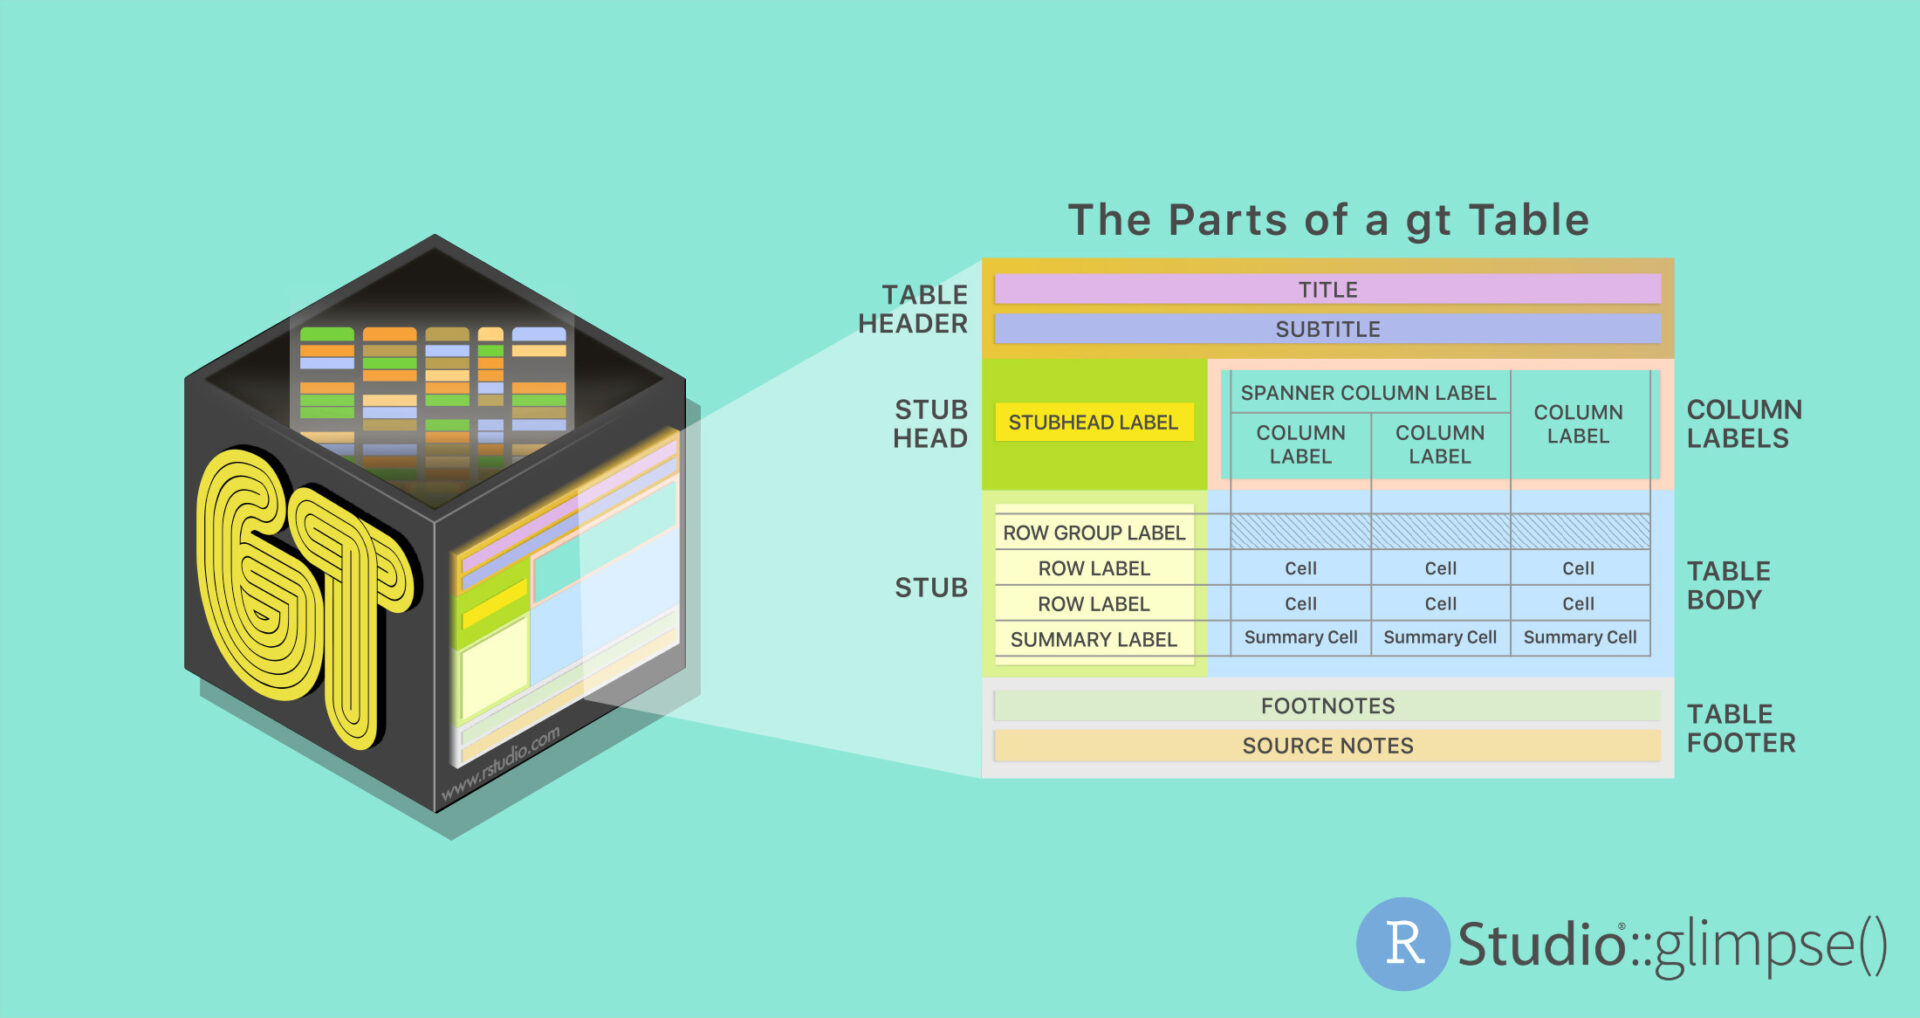
What’s new in {gt} tables?
A look at some new features in the {gt} package.
gt
tables
news
In this post we will explore some of my favorite new (and some old) features in {gt} tables
Jan 25, 2024
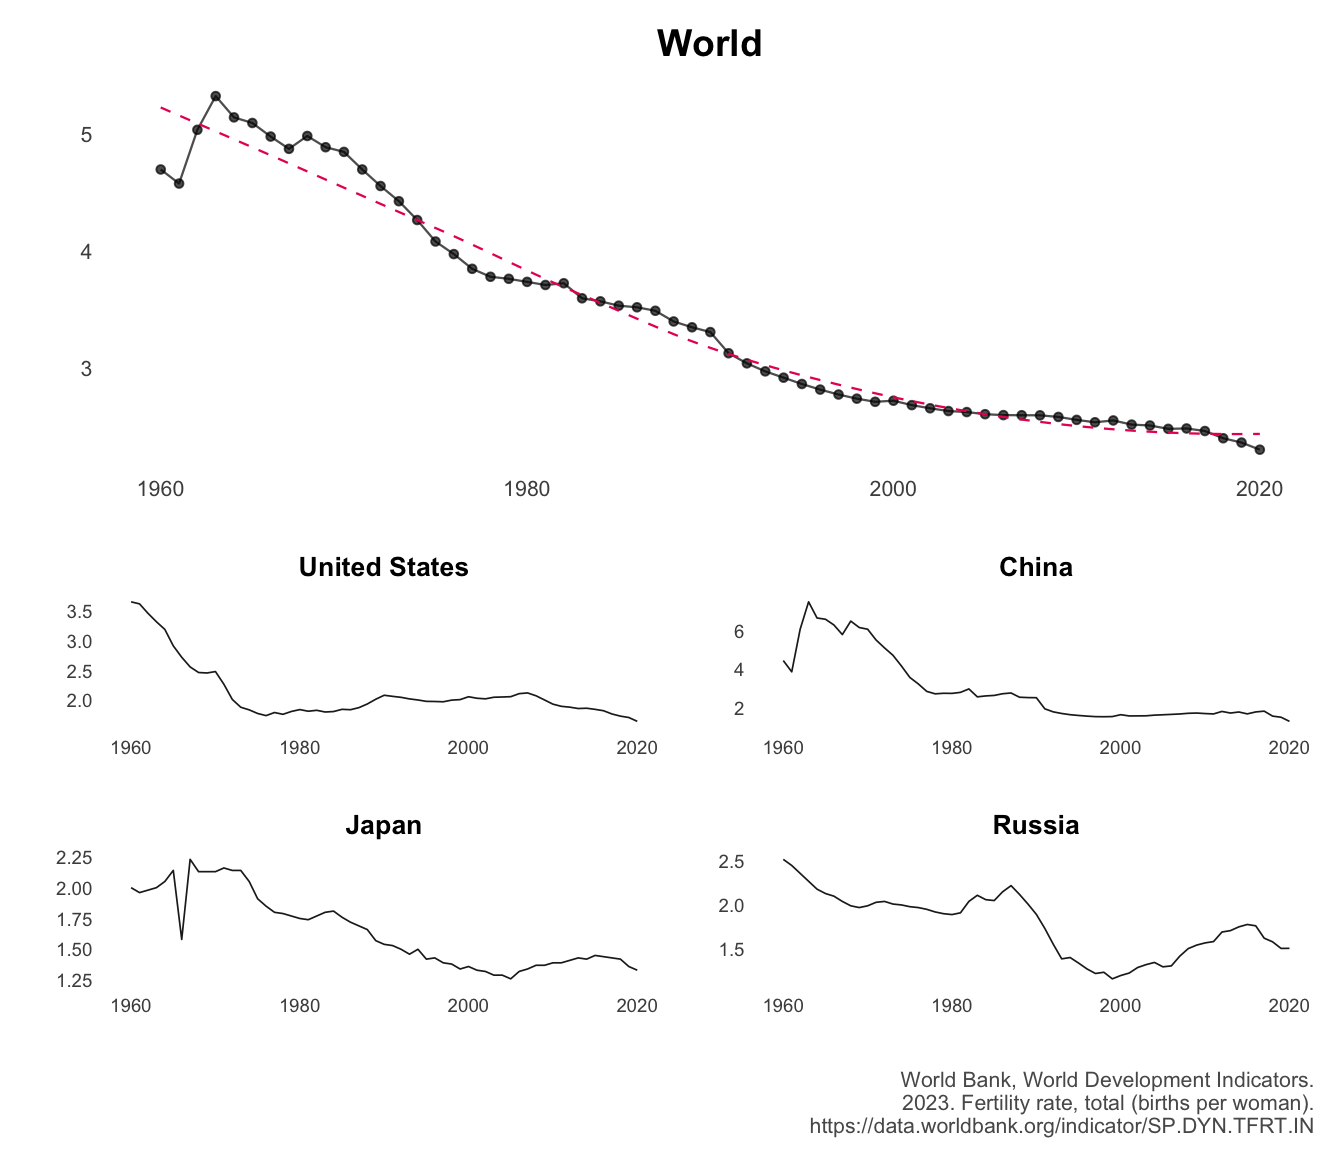
Exploring Global Fertility: A Journey Across Borders
123
Second Tag
This is a test post. In this post, I try out different functionalities
Dec 25, 2023
No matching items